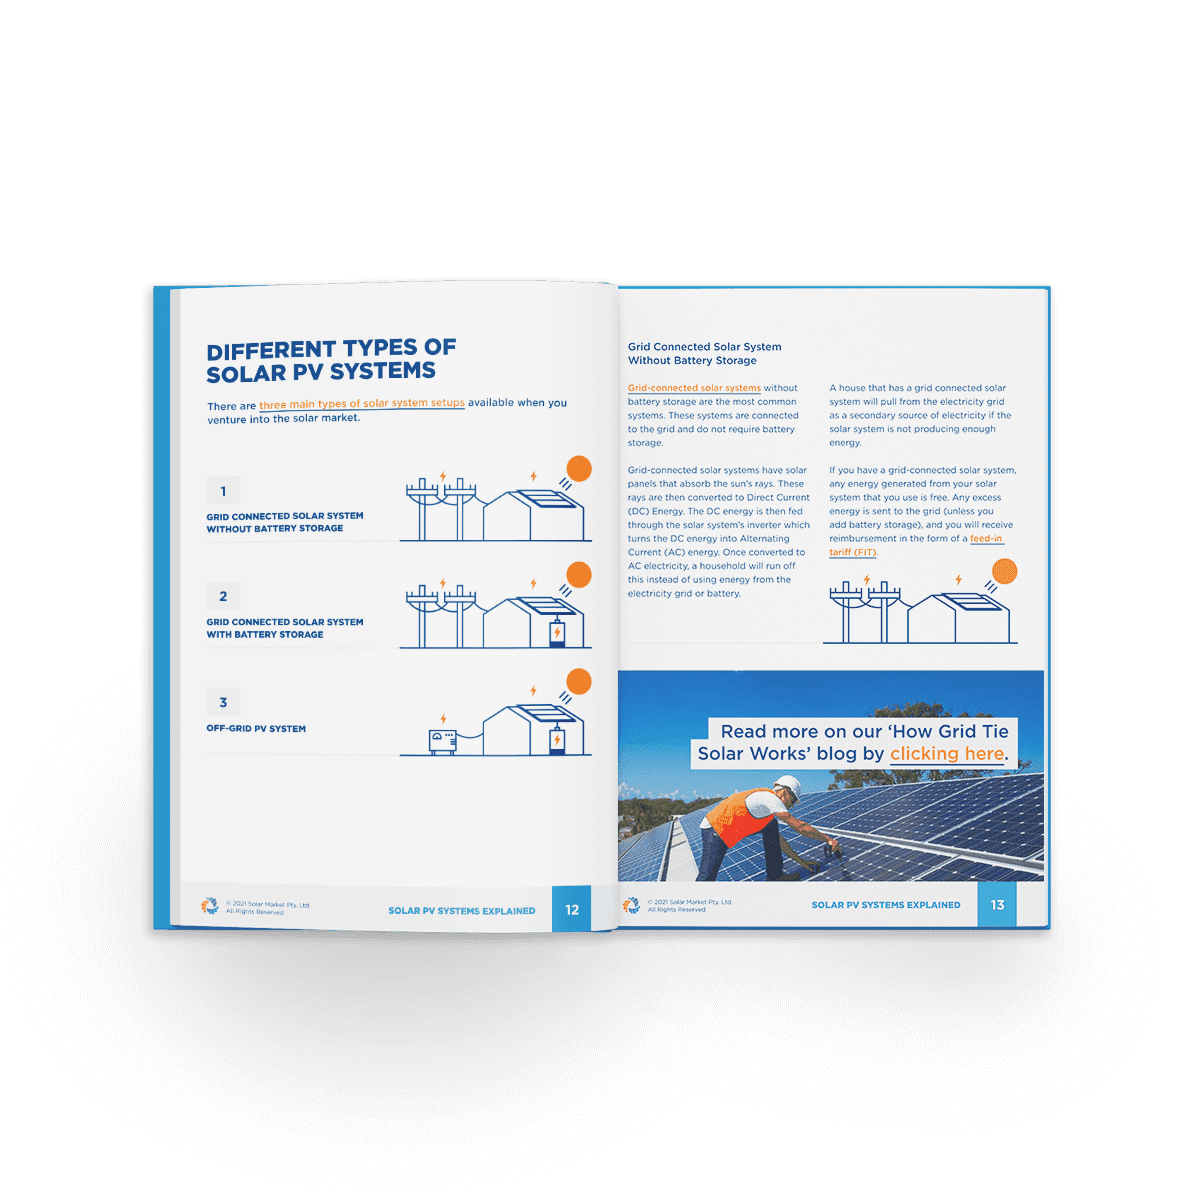
Adding value to your property, shading the roof and reducing your carbon footprint are just some of the benefits of owning a quality solar electricity system. However, reducing or eliminating the electricity bill is overwhelmingly the number one reason why one in six Australian households have chosen to invest in self-generated electricity using solar photovoltaic systems (or solar PV for short). The electricity bill savings from a solar PV system come in two distinct forms. Every state in Australia operates under a net feed-in-tariff which means that the electricity generated by the system can either be utilised by the home or any excess can be sold to the electricity retailer. In other words, the generated electricity can either be used to offset consumption and any surplus can be sold to the grid in exchange for monetary remuneration (dollars and cents) commonly referred to as the buyback rate or feed-in-tariff (FIT). In some states there are significant disparities between the feed-in-tariff and the home tariff, therefore, when assessing the potential savings form a solar PV system and its impact on the power bill, a key factor can be the proportion of the system’s production that is utilised by the household versus the excess electricity sold to the grid. As column four in the table below shows, there can be a big difference between utilisation and sale. For example, in South Australia it is almost four times more beneficial to use the power from the solar system as opposed to selling it to the grid.
| State | Total Feed-in Tariff (selling to the grid) |
Home Tariff (Utilised power generated by PV) | Utilisation versus Sale (How much better off you are by using the power generated) |
|---|---|---|---|
| SA | 7.6 | 29.583 | 3.89 x |
| WA | 8.8529 | 25.9052 | 2.93 x |
| ACT | 7.5 | 20.13 | 2.68 x |
| VIC | 10 | 24.368 | 2.44 x |
| QLD | 18 | 29.174 | 1.62 x |
| NSW | 18 | 27.158 | 1.51 x |
| NT | 25.91 | 27.13 | 1.05 x |
| TAS | 26.807 | 26.807 | no better off |
Home Tariffs include GST. All prices are in cents. On the surface, looking at the difference between the feed-in-tariff and the home tariff it’s easy to come to the conclusion that selling power to the grid is not worth it. A closer, rational examination of the figures, however, reveals a different conclusion. To illustrate the point, let us assume the worst possible case scenario. If we take a 5kW system installed on a vacant property that uses zero electricity it means that 100% of the power generated by the PV system will be sold to the grid at the buyback rate. In Sydney for instance the 5kW system should generate approximately 19.5 kilo Watt hours ( kWh ) or units of electricity on an average day. Multiplied by the 18c buyback rate available in NSW the system will generate $3.51 a day or approximately $1,281.15 in the first year. Based on a supply and install cost of say $10,000, $1,281 yields a 12.81% simple return on investment in just the first year. Considering bank deposits and rental property yield around 3 to 4%, selling solar generated electricity to the grid is simply a superior option. Even the stock market pales in comparison. Currently the highest yielding blue chip stock is Telstra which currently trades at a 5.3% dividend yield (or 7.6% grossed up), however there is always the very real risk that the shares may decline in value. On the other hand, electricity prices have only ever moved one way and that’s up.
Scenario #1: 0% of solar power generated is used by the home
The below table shows the expected return on investment if 0% (none) of the electricity generated by the system is used by the home. System Cost: $10,000 Marginal Tax Rate: 30% Export Percentage: 100%
| City | Average Daily Production 5kW System | Total Feed-in-Tariff ($/kWh) | Estimated First Year Revenue ($) | Simple After Tax Equivalent ROI (%) |
|---|---|---|---|---|
| Darwin | 22 | 25.91 | $2,081 | 29.72% |
| Hobart | 21 | 18 | $1,712 | 24.46% |
| Brisbane | 17.5 | $1,380 | 268% | 19.71% |
| Sydney | 19.5 | 18 | $1,281 | 18.30% |
| Perth | 21 | 7.6 | $711 | 10.16% |
| Melbourne | 22 | 8.8529 | $657 | 9.39% |
| Canberra | 18 | 10 | $589 | 8.41% |
| Adelaide | 21.5 | 7.5 | $583 | 8.32% |
Average Daily Production as per CEC guidelines. Of course, the above is quite an unrealistic scenario as we have assumed the property uses no electricity whatsoever. The fact is that, even if the property is unoccupied, most houses consume at least some standby power which can add up to several kW hours a day. Considering a more realistic scenario, the average Australian household consumes approximately 20kW hours a day and households where both parents work nine-to-five and children are at school can consume 40 – 60% of their electricity during daylight hours, when the solar PV system is producing electricity which can be utilised by the house rather than sold to the grid.
Scenario 2: 50% of solar power generated is used by the home
If we assume that 50% of the PV system’s production can be utilised the figures are as follows: 19.5kWh x 50% = 9.75kWh 9.75kWh x 27.15c = $2.64 / day in savings 9.75kWh x 18c = $1.75 / day in credits $2.64 + $1.75 = $4.39 x 365 = $1,602 in year 1 Based on a $10,000 system cost that’s a 16% return on investment or almost 23% as an after tax equivalent based on a 30% marginal tax rate. The below table shows the expected return on investment if 50% of the electricity generated by the system is used by the home. System Cost: $10,000 Marginal Tax Rate: 30% Export Percentage: 50%
| City | Average Daily Production 5kW System | Total Feed-in-Tariff ($/kWh) | Average Home Tariff (Utilised power from PV) | Estimated First Year Revenue ($) | Simple After Tax Equivalent ROI (%) |
|---|---|---|---|---|---|
| Darwin | 22 | 25.91 | 27.13 | $2,130 | 30.42% |
| Brisbane | 21 | 18 | 29.174 | $1,808 | 25.83% |
| Hobart | 17.5 | 26.807 | 26.807 | $1,712 | 24.46% |
| Sydney | 19.5 | 18 | 27.158 | $1,607 | 22.96% |
| Adelaide | 21 | 7.6 | 29.583 | $1,425 | 20.36% |
| Perth | 22 | 8.8529 | 25.9052 | $1,396 | 19.94% |
| Melbourne | 18 | 10 | 24.368 | $1,129 | 16.13% |
| Canberra | 21.5 | 7.5 | 20.13 | $1,084 | 15.49% |
Average Daily Production as per CEC guidelines. Considering the difference between utilising the electricity produced by the PV system and selling it back to the electricity retailer, optimal system design can make a difference. If the roofspace allows the option, it may be beneficial to orientate panels in a manner to better match consumption and generation and hence maximise the likelihood of using the self-generated power from the PV system. For example, most households use power in the mornings with an even higher consumption peak in mid to late afternoon when the family comes home from work and school and the air-conditioning is turned on in summer. So, depending on the difference between the feed-in-tariff and the home tariff it may be beneficial to sacrifice some generation by installing panels away from the north and orientating them towards the west or installing what is called a ‘split array’ where some panels are on the eastern side and hence taking in the morning sun and some panels are on the western side of the roof where they are exposed to the afternoon sunlight. Alternatively, battery storage can be used to shift the availability of the solar generated electricity. Unfortunately, quality battery storage systems are currently too expensive and more often than not uneconomic in a residential setting particularly as the batteries can have an expected lifetime of only 7 to 10 years.
The best way to match consumption with generation is through behavioural change
Many solar households have found they are able to shift a proportion of their otherwise night time consumption to daylight hours. For example, a dishwasher can still be stacked after dinner and the timer can then be set to come on at around lunchtime the following day when the sun is out and the solar PV system is producing electricity. Similarly washing machines, dryers and other appliances can be set to automatically power on during the day. It can also be more efficient to prevent a home from heating up then to cool an already hot house, so reverse cycle air-conditioners are another appliance that can be used more efficiently and more optimally in terms of solar.
By shifting consumption patterns as well as through optimum array orientation a household may be able to significantly increase their utilisation rate. Many households use more than the average 20kW hours a day so it is not completely unreasonable to also consider a scenario where 100% of a system’s production is being used by the home.
Scenario 3: 100% of solar power generated is used by the home
Based on a 100% utilisation rate and using the same scenario as above, the after tax equivalent return on investment for the Sydney property would be an incredible 28% (once again based on a 30% marginal tax rate). The simple payback period would be around three years, however, this assumes that the cost of electricity does not increase over that three year period. Considering that electricity prices have almost doubled in the last 5 years the actual payback period would naturally be even shorter if electricity prices continue to rise. The below table shows the expected return on investment if 100% of the electricity generated by the system is used by the home. System Cost: $10,000 Marginal Tax Rate: 30% Export Percentage: 0%
| City | Average Daily Production 5kW System | Average Home Tariff Utilised power from PV | Estimated First Year Revenue ($) | Simple After Tax Equivalent ROI (%) |
|---|---|---|---|---|
| Adelaide | 21 | 29.583 | $2,268 | 32.39% |
| Brisbane | 21 | 29.174 | $2,236 | 31.95% |
| Darwin | 22 | 27.13 | $2,179 | 31.12% |
| Perth | 22 | 25.9052 | $2,080 | 29.72% |
| Sydney | 19.5 | 27.158 | $1,933 | 27.61% |
| Hobart | 17.5 | 26.807 | $1,712 | 24.46% |
| Melbourne | 18 | 24.368 | $1,601 | 22.87% |
| Canberra | 21.5 | 20.13 | $1,580 | 22.57% |
Average Daily Production as per CEC guidelines. It needs to be noted that solar panels degrade and produce less power each year so to protect your investment it is important to not only use a reputable installer but to also use only quality tier 1 panels from an established manufacturer who will be in business for the term of the warranty. It is also important to understand the performance warranty to ensure that you have recall if the panels underperform the warranted maximum degradation amount. Most tier 1 manufacturers now offer linear performance warranties with a maximum degradation of around 0.5% per annum over a 25 year period. Furthermore, product warranties range from 5 to 12 and in some cases 25 years which is really quite incredible when compared to the 3 to 5 year warranties offered on new cars these days. So, as long as the system is designed and installed by a reputable and competent installer using high quality components with good warranties, you can expect double digit returns and short payback periods for what is essentially a risk-free investment because electricity prices have only ever increased and the sun should hopefully continue to shine for the next four billion years. Workout how much you could save with solar, try our Solar Savings Calculator here