Australia was warned earlier this year that a shortage of gas could create an energy crisis. A report from the Australian Energy Market Operator (AEMO) suggested a shortfall could occur in 3 of the next 13 years.
This report was widely reported in the national media, with sensational headlines like “AEMO warns of blackouts as gas runs out”.
A couple of weeks ago, in a dramatic intervention, Prime Minister Malcolm Turnbull declared that there was a shortage of gas supplies for eastern Australia and that certain restrictions may be placed on gas exports.
But do we really need “more gas supply and more gas suppliers”? In a report published today, my colleague Tim Forcey and I review AEMO’s initial report and its results and recommendations. Our work finds there is a shortage of “cheap” gas, but not a gas supply “shortfall”. Moreover, high gas prices combined with falling renewable and storage costs mean that there are cheaper options than developing new gas resources.
What gas shortfall?
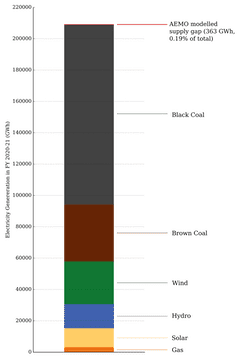
The AEMO report suggests that eastern Australia face a shortfall in 3 of the next 13 financial years – 2018-19, 2020-21 and 2021-22. The largest gap modelled by AEMO is equal to only 0.19% of the annual electricity supply, or 363 gigawatt hours.
In gas supply terms, this is equivalent to only 0.2% of the annual gas supply. But AEMO’s modelling considers a range of possible scenarios, with a variation of roughly plus or minus 5%, far larger than the possible shortfall.
Just 11 days after the report warning of a supply gap, AEMO published updated electricity demand forecasts. In this update, AEMO reduced its forecast electricity demand by roughly 1%. This reduction in demand is more than four times greater than the largest forecast shortfall.
A day later, Shell announced it would proceed with Project Ruby, a gas field with 161 new wells. This was not included in the AEMO modelling process.
Alternatives to gas
Gas has historically been characterised as a transition fuel on the pathway to a zero-emissions power system. The falling costs of renewable energy and storage technologies combined with rising gas costs means this pathway and may indeed be a detour, particularly when taking into account Australia’s climate commitments.
This is also a sentiment increasingly reflected by the industry, with gas producer AGL suggesting that:
the National Electricity Market […] here in Australia could transition directly from being dominated by coal-fired baseload to being dominated by storable renewables.
Gas generation generally falls into two categories: open cycle gas turbines (OCGT) and combined cycle gas turbines (CCGT). These two technologies effectively play different roles in the energy sector. Open cycle turbines are highly flexible, and are used occasionally over the year to provide peak capacity. Combined cycle turbines, on the other hand, operate continuously and provide large amounts of energy over a year.
Each of these technologies is now under competitive threat from renewable generation and storage. Flexible capacity can also be provided by energy storage technologies, while bulk energy can be provided by renewable energy. These are compared below.
Energy: renewables vs gas
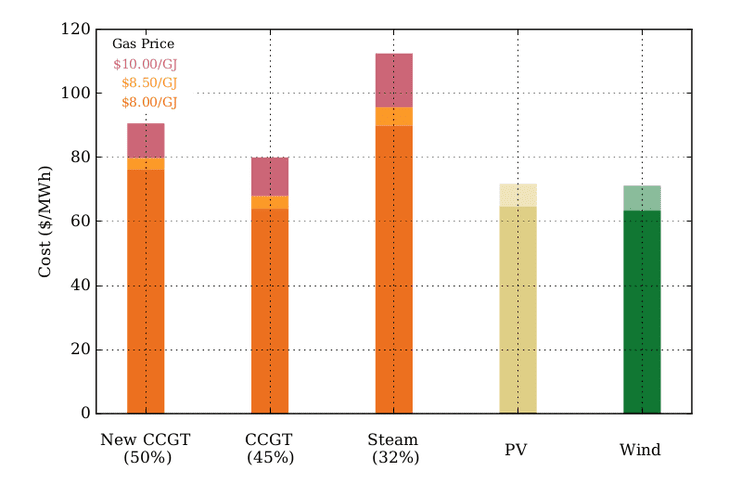
The chart below compares the cost of providing bulk energy with gas and renewable technologies. We’ve represented the price of new CCGT, PV (which stands for photovoltic solar) and wind as the cost of providing energy over the lifetime of the plant.
The other two gas generation costs illustrated, CCGT and Steam, represent the cost of energy from existing plants, at their respective thermal efficiencies. The steam thermal efficiency is similar to that of a highly flexible open cycle gas turbine.
Surprisingly – and depending somewhat on gas price and capital cost assumptions – new renewable energy projects provide cheaper energy than existing gas generators.
Flexible capacity: storage vs gas
The next chart compares the cost of providing flexible capacity from gas and storage technologies (again, taking the cost over the lifetime of the plant).
In this analysis we compare the cost of capacity from OCGT with that from diesel and various storage technologies, including battery and Pumped Hydro Energy Storage (PHES). As can be seen, storage technologies can compete with OCGT in providing flexible capacity, depending on technology and capital cost.
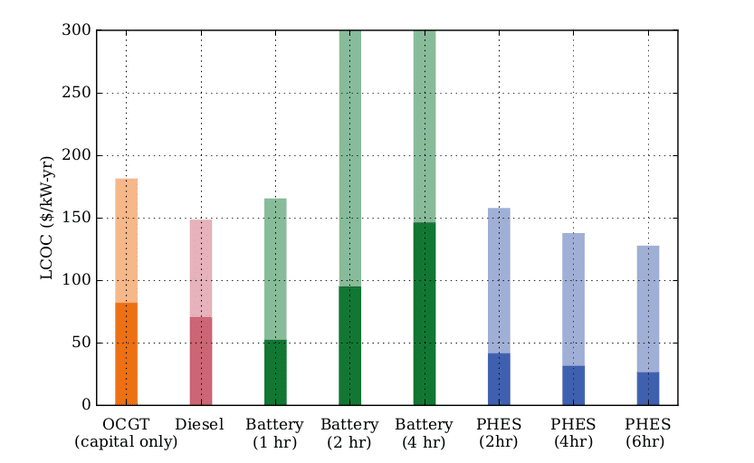
Another option, not shown here, is demand response. This is the strategy of giving consumers incentives to reduce their energy use during critical times, and is cheaper again.
What is clear is AEMO’s forecast gas shortfall is very small, and that it may have already been made up by revised demand forecasts and new gas field developments. But the question of how Australia should deal with any future shortfall invites a larger debate, including the role of gas in our electricity system, and whether the falling costs of renewable energy and storage technology mean we’ve outgrown gas.