Last updated Nov 2025
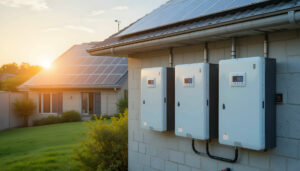
The solar system for home energy production someone chooses to install at their property should be selected based on a household’s annual electricity needs, whether battery storage is going to be added, and the size restrictions set in the household’s location.
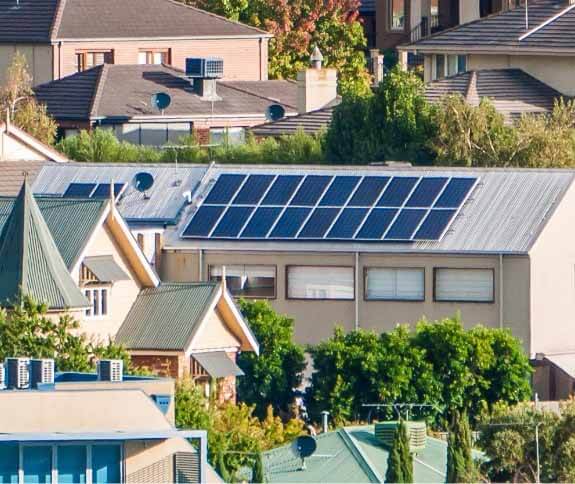
In Australia, the most common grid-connected solar system size for homes ranges from 6.6kW to 13.3kW. As of 2025, 6.6kW remains the most widely installed size, though 10kW systems are growing in popularity. These system sizes generate enough energy to power a household during the day while significantly reducing electricity bills, ensuring a faster return on investment.
If you’re looking at a solar system for your home, the bigger it is, the more electricity it can generate and the less reliance your household will have on the electricity grid and energy retailers. The less reliance you have on the electricity grid and energy retailers, the bigger the reduction on your energy bills!
See our below table that compares different solar system sizes, the number of panels installed, estimated production, and approximate prices in today’s market.
Please note: Energy production will differ from State to State depending on how many sunlight hours the location receives. See average daily production in Australian major cities here.
| System Size | Number of Panels (440 watt) | Estimated Production Annually (Sydney) | System Price (Approx) |
|---|---|---|---|
| 6.6kW | 15 | 9,500 – 10,500 kWh | $5,500 – $9,000 |
| 10kW | 23 | 14,200 – 16,400 kWh | $8,000 – $13,000 |
| 13.3kW | 30 | 19,000 – 21,600 kWh | $10,000 – $18,000 |
| 20kW | 46 | 28,600 – 32,500 kWh | $18,000 – $22,000 |
What Size Solar System Do I Need?
The best way to determine what solar system size is suited to you is to look at three key factors: physical space, energy requirements and price.
Physical Space – Solar Panel Size Australia
The space available on your roof may be the deciding factor of what solar system size you opt for. The approximate size of a 440-watt solar panel in Australia mean you will require approximately 2m2 of space per panel. With that in mind an average 6.6kW solar system for your home will have 15 panels in the solar array. That’s approximately 30m2 of required roof space.
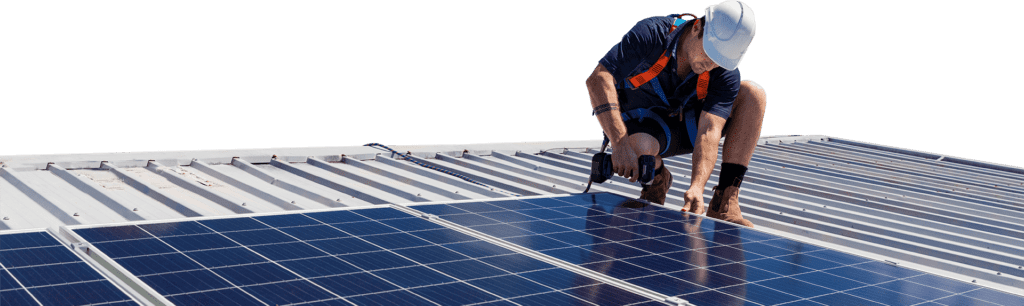
So before deciding on a solar system size it’s best to ensure you know how many panels you can fit on your roof. Solar installers usually provide home visits in the quoting process to assist with determining this.
Solar System For Home Energy Requirements
With residential solar, systems size in Australia should vary based on need (turns out you can have too much and too little solar!).
A well sized system is one that produces energy that closely matches the real usage of the household.
This way the solar system can cover the majority, if not all of your electricity bill.
The best way to determine if you’re getting enough solar is to look at old energy bills you’ve received throughout the year and select a solar system size that has an estimated production that matches your bill average or exceeds it.
To close off this guide to solar panel size in Australia, you can use the table below to see what solar system size most closely matches your energy needs. Your average daily consumption per billing period should be displayed on your electricity bill.
| Months | Daily Average (kWh) units |
|---|---|
| September – February | 4.6 – 5.9 |
| March – April | 4.4 – 4.9 |
| May – August | 3.1 – 3.9 |
Pricing of A Solar System For Home Energy Production
How much you are willing to pay for a solar system for home use can be the limiting factor on what solar system size you select. However these days solar systems are becoming more affordable due to a drops in prices, Government rebates remaining available and the ready access to green loans to help assist with the upfront costs.
See our solar system pricing page to view estimated prices in today’s market.