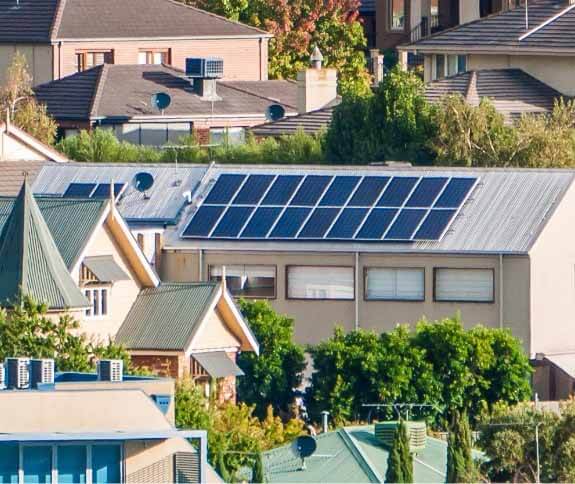
There are many factors that can affect a solar systems production and output. These factors can include shading, roof orientation, roof pitch and the season. When looking to install a solar system it’s best to keep these in mind so that you can position your system in a way that will give you optimal solar production.
Shading
Shading has a large effect on the performance of a solar power system. Outside the hours of 9am-3pm you can get away with some shading however shading within these hours can have a drastic affect to your solar production and energy savings.
Even partial shading of the system can have a large effect as all panels in a section need to run at the same voltage. If one panel is shaded even partially, this will bring down the production of the whole system. There are ways around this such as splitting the array into multiple strings or using micro inverters on the back of panels.
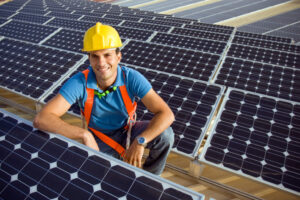
Always ask your installer when being quoted what effect shading will have and what your options are to combat any shading.
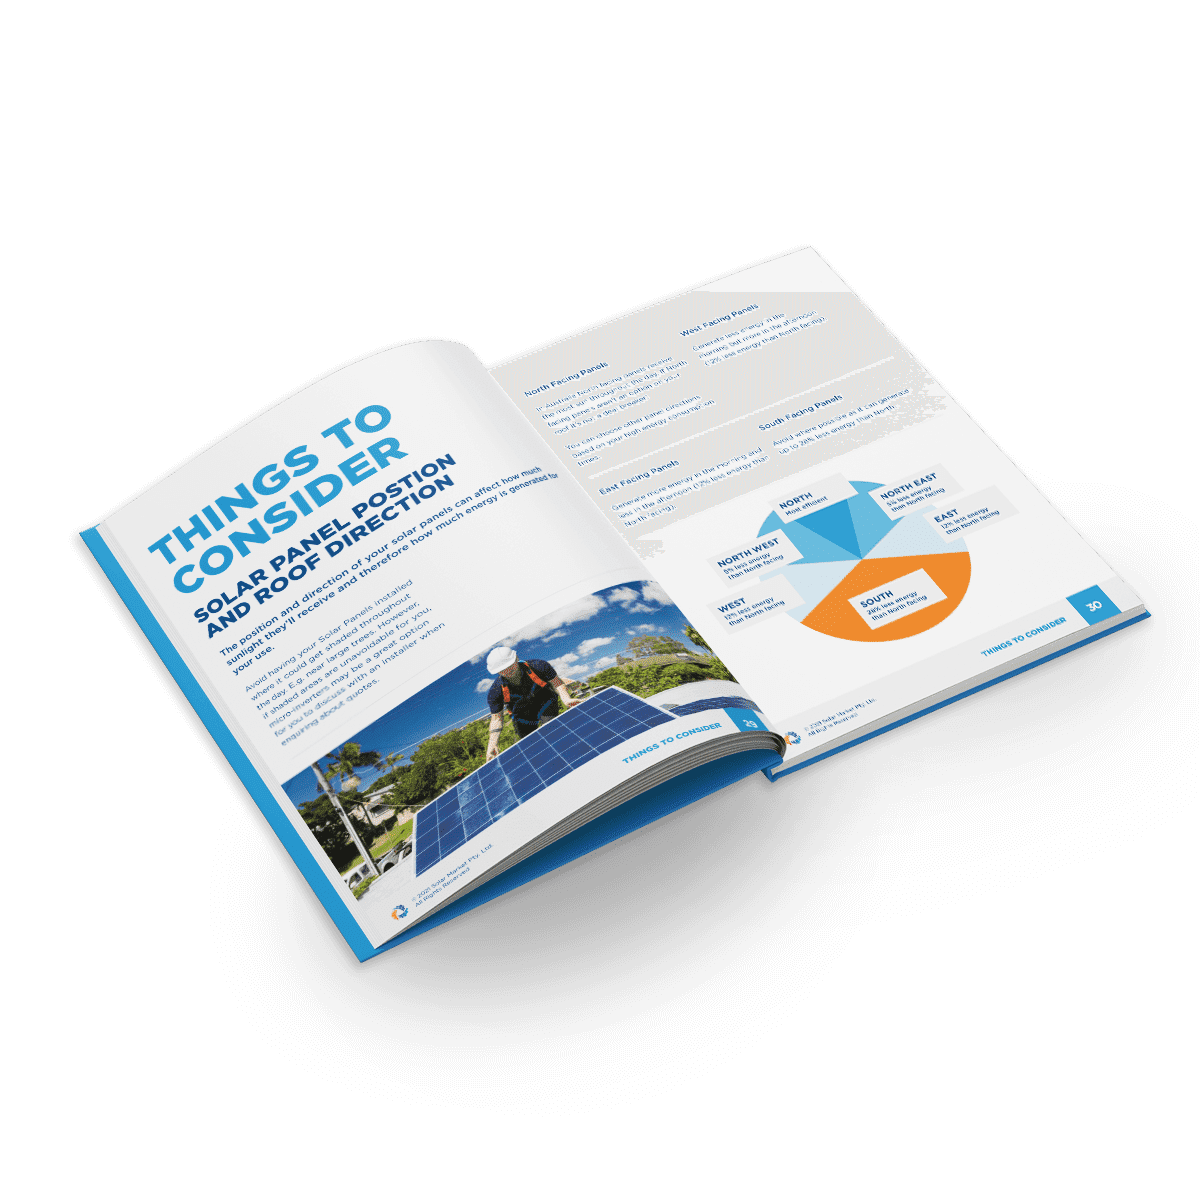
Roof orientation
In the southern hemisphere (Australia), north facing roofs are the best for solar. If your roof isn’t north facing, that’s okay, the loss from facing the system east or west won’t matter too much and you can have your panels placed to suit your high energy usage times.
| Roof Orientation | Production Loss |
|---|---|
| North | no losses |
| North East/North West | 7% loss |
| East/West | 12% loss |
| South | 28% loss |
| Direction | Time of Day |
|---|---|
| North | Receives the most sunlight throughout the day |
| East | Generates more energy in the morning and less in the afternoon |
| West | Generates more energy in the afternoon and less in the morning |
| South | Avoid when possible |
Roof inclination
To get the best production from your panels, your roof should be pitched at the same degrees as the latitude of your location.
For example, Brisbane’s coordinates are as follows – Latitude 27°25’S – Longitude 153° 9′ E.
This means that the best roof pitch is 27 degrees which is about what most roofs are.
If your pitch is different to this, don’t worry, for every 5 degrees difference from this, you lose 1% production. So if the panels were laid flat, you’d only lose about 5% production.
It’s recommend you have at least have about 5 degree tilt so that water can run off and the panel can self clean.
Tilting panels
Should you use tilt frames to tilt your panels so that they’re closer to the optimal angle? In 95% of cases, we would suggest using the extra money on more panels than tilt frames. This is because as mentioned before the difference in production for a 25 degree roof and a 0 degree roof is only 5%. Tilt frames may also have the following drawbacks:
- They can catch the wind and can act as a sail putting greater stress on your roof structure.
- Any increased production is offset by needing to leave spaces between rows of panels so that panels don’t cast shadows over each other.
- Increased cost for the frames plus increased labour costs.
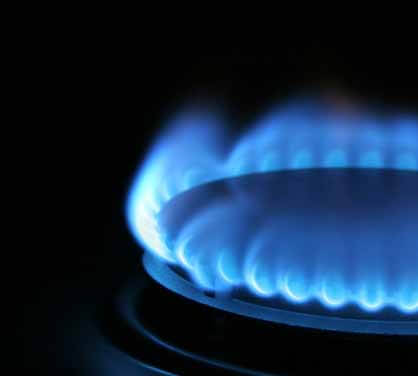
Summer vs winter production
Solar systems will always produce more energy in summer than in winter and this is due to the sun being higher in the sky and the days being longer. One interesting point which most people don’t realise is that solar systems don’t like too much heat and will produce around 20% less energy than their peak on a 40-degree day. Therefore, you may find that your solar system hits its peak production at any one point in time during spring or autumn. Overall though, your system will produce more units of energy during the summer months due to the longer days.
The temperature co-efficient is a guide for how much your panels dislike the heat and also an indicator of quality. This number tells you how much your panels will lose in production for every 1 degree over 25 degrees of surface temperature. The lower this number, the better.
| Avg Daily Production | = | 1kW (production from table below) |
x | System Size | x | 1 – percentage loss from shading – percentage loss from inclination – percentage loss from roof direction |
|---|
See the guide below and then take into account the factors below, which will reduce the systems production.
Average daily production
| City | 1.0kW system | 1.5kW system | 2.0kW system | 3.0kW system | 4.0kW system |
|---|---|---|---|---|---|
| Adelaide | 4.2kWh | 6.3kWh | 8.4kWh | 12.6kWh | 16.8kWh |
| Alice Springs | 5.0kWh | 7.5kWh | 10.0kWh | 15.0kWh | 20.0kWh |
| Brisbane | 4.2kWh | 6.3kWh | 8.4kWh | 12.6kWh | 16.8kWh |
| Cairns | 4.2kWh | 6.3kWh | 8.4kWh | 12.6kWh | 16.8kWh |
| Canberra | 4.3kWh | 6.45kWh | 8.6kWh | 12.9kWh | 17.2kWh |
| Darwin | 4.4kWh | 6.6kWh | 8.8kWh | 13.2kWh | 17.6kWh |
| Hobart | 3.5kWh | 5.25kWh | 7.0kWh | 10.5kWh | 14.0kWh |
| Melbourne | 3.6kWh | 5.4kWh | 7.2kWh | 10.8kWh | 14.4kWh |
| Perth | 4.4 kWh | 6.6 kWh | 8.8 kWh | 13.2 kWh | 17.6 kWh |
| Sydney | 3.9 kWh | 5.85 kWh | 7.8 kWh | 11.7 kWh | 15.6 kWh |
| Data Source: PV-GC spreadsheet based on the CEC GC Design Guideline The Rated output is that achieved in perfect laboratory conditions. The CEC design summary software takes these deratings into |
|||||