We all know that the price of electricity has gone up over the years.
However, just how much has it risen in the different states and what has been causing these rises?
Firstly, here’s the average increases in electricity prices for householders from 2007-08 to 2013-2014 (7 years).
Note: These figures do not include rises in the 2014-15 & 2015-16 Financial Years so the real figures are higher than those listed below.

So the big question is: What caused these ridiculous price rises (that now make Australia one of the most expensive countries in the world for electricity)?
Well, if you read on the surface, it was down to the need to spend on replacing aged infrastructure (“Poles and Wires”).
According to a report from St Vincent de Paul Society and Alviss Consulting, their analysis showed network costs charged for poles and wires made up as much as 60% of some electricity bills.
Note: The report did not take into account Western Australia or the Northern Territory, which are not part of the national energy market.
All this sounds fair enough. After all, the network infrastructure does need to be kept in good working order or we get power blackouts which upset everybody.
However, as with most complex topics, what’s on the surface is often NOT the real truth or all the facts, and this situation is no different.
A lot of Australians already know that spending on network infrastructure has had the biggest effect on prices, but MOST Australians don’t really know the full story…
In her research into the reasons for electricity rises “Power Corrupts“, investigative reporter Jess Hill states:
“The astonishing story behind these price hikes has been all but ignored. And yet, it may be one of the greatest rorts in Australia’s history”
Since 2009, the increased spending (termed “gold plating”) by our electricity networks has reached (and most likely surpassed) $45 BILLION (yes, that’s Billion with a capital B!) and most of it has been for infrastructure we don’t need, but we are having to pay for in the form of increased electricity prices.
So, how did this happen and more importantly, why did it happen?
Long story short, it came down to the networks claiming the need to massively invest in new infrastructure to replace aging systems or have the country be hit with regular summertime rolling blackouts. All this was justified by data provided by the National Electricity Market Management Company (NEMMCO). They’re the organisation responsible for administering and managing the national electricity market.
The only problem was that NEMMCO didn’t collect its own data. That was provided by the networks themselves, and according to Energy Industry expert Bruce Mountain, that data was “rubbish”!
Even worse, the claims by the networks that demand for power was also rising (which also was given as the reason for the need to increase power production capacity) also turned out to be “grossly exaggerated” according to Mountain.
In actual fact, according to the Australian Energy Regulator (AER) figures, demand for power started to flatten out in 2009, and it’s been trending down ever since.

Source: AER National Electricity Market electricity consumption
The reason for the downward trend has mostly been put down to the significant uptake of solar power within Australia, combined with an uptake in energy efficient appliances purchased and used by consumers and business.
With over 1.4 Million Aussie homes now equipped with Solar panels on their roof, the ability to produce electricity independent of the power grid has seen less demand for grid-generated power as time goes by.
Yet, the major network operators said otherwise and used this “grossly exaggerated” data to get approval to go on a spending spree ($45 Billion!) the likes of which this country has never seen before!
Again, according to Bruce Mountain “Between 2006 and 2013 the distributors in these states (QLD & NSW), on average, expanded their substation capacity 108 times more than the increase in peak demand.” Source
As for the reason/s this happened… it’s complicated (read Jess Hill’s article – it explains it in more detail) but the short version is that the way the networks make money is essentially incentivized by spending money on infrastructure. The more they spend, the more they make, and it’s the electricity consumer (you & I) who ultimately pays that cost in the form of increased power bills. Jess Hill added this little “factoid”:
“According to the Australian Bureau of Statistics, the electricity industry’s profits rose by 67% between 2007–08 and 2010–11. In this same period, electricity bills rose 40%.”
So, without repeating all of Jess’s article, what’s the solution if your power bills have gotten out of control over the years?
Well, there’s not much you can do about the price of electricity itself. In some areas there is only one supplier and those people don’t have a choice of switching for a better deal.
How To Take Back Control Of Your Power Bills
So, the option that makes the most sense for home owners is to look at installing a solar power system on their roof.
By generating some of your electricity free from the sun, you can reduce the amount of grid-generated power you need to purchase, and therefore reduce your power bills into the bargain.
Solar power is a LOT more cost effective with prices for systems having dropped on the order of 70-80% in the last 5 years.
That makes the payback period for solar more attractive these days, and it’s not uncommon for systems to have paid for themselves in full in as little as 4-5 years just by reducing your power bills. According to a study done by Curtin University, an average household with daily electricity use of 25kWh can save $960/year* on electricity just by installing a 5kW solar system.
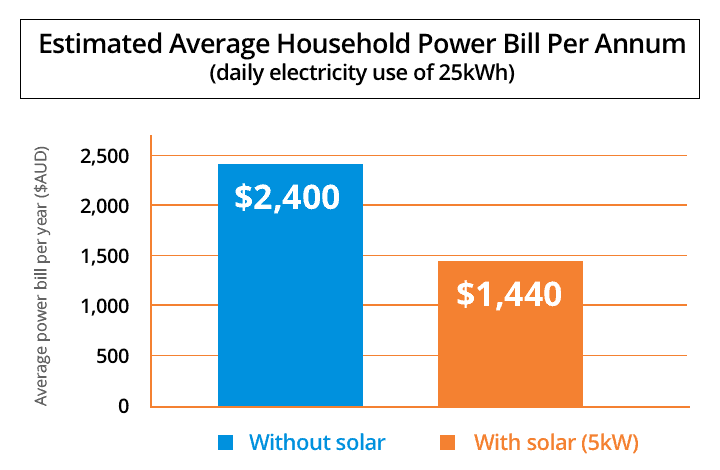
*Estimated savings of an average WA household, with daily electricity use of 25kWh, installing a 5kW solar system, maximising daytime appliance use, on the current feed-in tariff of 7 cents per kWh.
Add in rebates on the upfront purchase price of a solar power system of up to $4650, and solar has a compelling argument to make for those homeowners who want to reduce their ridiculous power bills to a much more manageable level.
- Estimated incentive for 3kW system: $2,325
- Estimated incentive for 4kW system: $3,075
- Estimated incentive for 5kW system: $3,862
- Estimated incentive for 6kW system: $4,650 ^
^ A 6kW system installed December 1st in Perth or Sydney would produce 124 small-scale technology certificates (STCs) (https://www.rec-registry.gov.au/rec-registry/app/calculators/sgu-stc-calculator). At a price of $37.50, this equals $4,650. The price of STCs is calculated based on market value and is subject to change. Check online to get the most accurate price.
Solar power systems can pay for themselves in electricity savings in as little as 4 – 5 years, can help cut your electricity bill by up to 75% and protect you against rising electricity costs (expected to rise 40% over the next 10 years). In addition, once your solar system is paid in full (via savings from lower power bills), every year it keeps operating after that adds more and more savings into YOUR pocket, not the greedy power companies. A good quality system should run for 15-20-even 25+ years, and the savings generated over that time are SIGNIFICANT (in the potential order of tens of thousands of dollars!).
Check out our FREE solar savings calculator here to get an estimate of how much you could save over the lifetime of your solar panel system.
Get 3 Quotes For Solar
Since 2010, Solar Market has helped over 146,742* home and business owners find the best deal from solar installers in their local area
On top of assisting you in sourcing 3 solar quotes, we provide independent and unbiased information on the critical questions you’ll need answered in order to get the best solar system installed at the best price, hassle free.
*As of 16/12/15